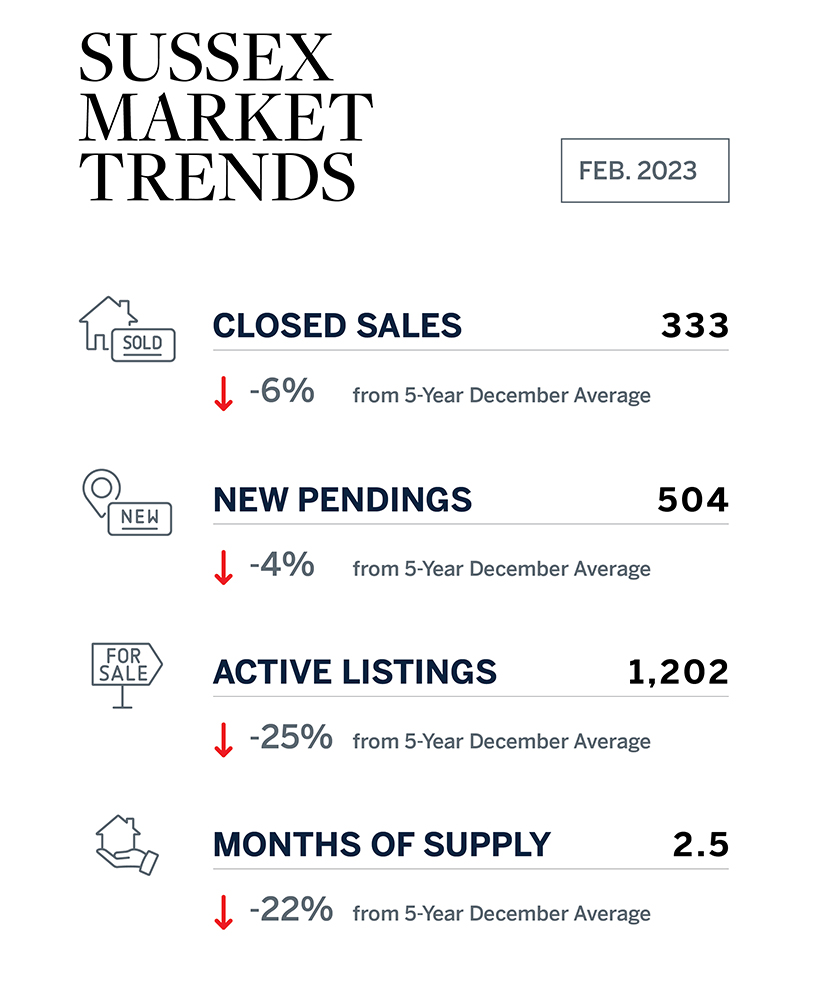
Monthly Snapshot: Sussex County, DE
Year-In-Review: Sussex County 2020
January 1, 2020 through December 31, 2020
2020 | 2019 | % Change | ||
Sold Dollar Volume | • | $3,069,315,077 | $2,194,175,812 | 39.88% |
Avg Sold Price | • | $416,394 | $371,628 | 12.05% |
Properties Sold | • | 7,338 | 5,898 | 24.42% |
Avg Days On Market | • | 76 | 92 | -17.39% |
Avg LP Sold Properties | • | $419,268 | $374,113 | 12.07% |
Avg SP to OLP Ratio | • | 98.0% | 96.8% | 1.31% |
# SF Sold | • | 5,281 | 4,424 | 19.37% |
Avg SF Sold Price | • | $431,477 | $380,757 | 13.32% |
# C/TH Sold | • | 2,057 | 1,474 | 39.55% |
Avg C/TH Sold Price | • | $377,730 | $344,333 | 9.70% |
— KEY —
SF = Single Family • C/TH = Condo/Townhome
SP = Sold Price • OLP = Original List Price • LP = List Price (at time of sale)
Garage/Parking Spaces are not included in Detached/Attached section totals.
The information above provides a high-level overview of the market.
Please call or email your OASIR agent to get a snapshot of market conditions in your town or neighborhood.